Monday, 29 September 2014

Flatsheet and element filtration performance in EN779

Today's blog is about an issue that I have long felt strongly about, flatsheet and element performance of filter materials. The examples that I use are based on EN779 but the fundamental issues are ones that can be found anywhere in filtration, whether liquid or air filtration. 

Media suppliers are under increasing pressure to differentiate themselves from their competition. They work tirelessly to develop an optimised system with improve efficiency, lower pressure drop or longer lifetimes. The element manufacturers in turn work extremely hard on achieving the same goal in an element format, whilst at the same time also trying to ensure, in the competitive markets that they serve, that the overall cost (of either the element) or its total inservice cost (power consumption, lifetime) are competitive.

The real challenge for both parties is to be able to ensure that what is promised by the media supplier can achieve the same level of performance in the final element. The reality is that there is always a significant discrepancy between flatsheets and elements in any filtration system. 

The simplest reason for the discrepancy lies in simple geometry. A flatsheet test always presents the media at the optimal angle to the airflow (perpendicular), has no dead zones or turbulent flow of air. In real life the media is pleated or shaped in someway to maximise surface area and decrease face velocity. There are many element designs but the important issue is that the air and the contaminant are now channelled into a narrow gap, often in a turbulent way and then have to pass through the media at an oblique angle. 

The result is inevitably the following changes:

  • higher pressure drop at a given face velocity
  • lower material lifetime (as measured in dust holding capacity) versus a flatsheet. 
In general efficiency rarely alters significantly unless there is a significant issue (such as a design fault causing a change in face velocity in the element versus the flatsheet). 

This is where the element designer makes his money. The secret to good element design lies in minimising the effects of loss of media area and ensuring good pleat or bag separation to ensure even air or liquid flow through the element. 


The media can affect this in some ways- for instance thicker media reducing the space between pleats but, in general, this is less critical. 

In trying to clarify this better, I undertook a study looking at the differences between flatsheets and elements from F7 to F9 rating to EN779:2002. The tests were undertaken at the same face velocity of 12.7cm/s and the testing was carried out on two test stands, a standard EN779 test stand and a flatsheet test stand configured to run with EN779. The test dusts used were different. The element testing was undertaken with ASHRAE 52.1 test dust and the flatsheet testing was undertaken with SAE ISO Fine test dust. Both of these were clearly confounding factors but in reality all we wanted to achieve was an assessment of the offset between both test stands and between flatsheets and elements. 

The key to any offset analysis is to ensure that the data is taken at the same time on each test stand. In this case we can use the inferred data at 250, 350 and 450 Pa as our reference points. What this gives is 3 offset points per sample for both capacity and 0.4 micron efficiency.

Looking at the data we can see that there is a good offset for both properties


Thursday, 25 September 2014

The Filtration Industry- an aversion to change

Here is a statement that will divide opinions, the filtration industry has a major aversion to change. Why do I make this statement when we are bombarded with better performance all the time? The reason is that whilst media technology improves, real innovation change requires a fundamental change in the nature and design of filter elements. 

This requires the filter manufacturers to subsequently change their manufacturing processes and consequently there is an implied cost that the manufacturer is not prepared to, or can't, absorb.

So, in essence, any innovation from the media supplier has to fit with a pre-conceived element design technology that is desired by the element manufacturer or which is accepted by the wider market. In this blog I want to discuss some limiting issues that hinder the wider utilisation of new technology in filter media design. 

The material is too expensive
This is the top of everyone's list. If I had 1 Euro for every time I read that the new technology X was too expensive then I'd have retired to my luxury desert island long ago. 

All new technology has a cost whether it be the latest iPhone 6 or the latest filtration product from  H&V or Neenah Gessner. The problem is that most companies look at the headline cost of a filter material and immediately conclude that they can't afford it. The benefit of a technology is in terms of the value that it brings to the market. 

In filtration this is measured primarily in technical performance over the lifetime of the element plus any reduced costs in the manufacture of those elements. So the total value proposition is equal to the sum of the material + processing costs + value of the element performance i.e. cost per 1000km or 1000 hours of usage. 


The requirement is for....
Often existing specifications are the biggest barrier to change. Factors such as the paperwork changes, customer re-approval hinder innovation, element manufacturers become shortsighted and averse to change- "Cellulose plus phenolic resin does the job now, so why not in the future?" I've seen all sorts of examples of this including, it must be light yellow because that is what we use just now!


The Technology doesn't deliver what was promised...
My biggest gripe in this blog is the fact that flatsheet performance may deliver but the element manufacturer often can't see the benefit. For example if a new material doesn't fit the conventional expectations of thickness then the gap between pleats may become too narrow on a standard element. This means that the lifetime benefits of the technology are not fully realised. 

In short the failure here as in many developments lies both with the technology developer for not educating the element manufacturer but also with the element manufacturer who operates in a single dimension. 


This material won't process
Most filter elements in the automotive market are pleated elements. The technology for pleating elements has changed little in 50 years. The mechanical blade or rotary pleaters widely used in industry are relatively cheap in comparisons to other production technologies. The cost of a second hand pleater can be less than $60,000 and this will get you a good entry level production position into this market. The result is that the bulk of the after market in automotive filtration (which represents the bulk of filter sales) manufacturing still rely on mechanical processes that were ideally set up for 100% cellulose materials impregnated with a B-stage phenolic technology (itself over 100 years old) and they are often manufactured by smaller companies who have limited resources to be able to implement or develop significant change. 

This institutionalises filter material to be structured in a format that will fit easily to existing operating protocols and processes. This limitation in processing is the biggest barrier to change in the industry. 

It also impacts on the suppliers of media. If the market for the newest technology is limited due to limited capability to handle it, it makes the vendor risk averse to develop this technology further. 


he End User is Averse to change
Often the reluctance to change comes from the end users. New technology offers a benefit but radical changes in filtration create end user problems. An excellent example was the patented Donaldson Powercore fluted filter media technology. This technology offers a completely different filter design to traditional pleated packs, offering a compact, fluted element cartridge. 

Donaldson Powercore Air Filter Element
Donaldson patented to the technology and ruthlessly enforced the patent through legal channels but it was undermined by an industry that wanted a selection of manufacturers offering the technology for after market applications. 

The result was a slow uptake of the technology and Donaldson were forced to accept alternative suppliers such as Mahle and Mann and Hummel into the marketplace. 

In summary the reluctance of the end user to accept change is a barrier to implementation of new technology. 


Summary
This has been a rather personal overview of why filtration technology often doesn't change the paradigm and make dramatic changes. This is of course not always true with major advances in fuel filtration and hydraulic technology and the uses of nanotechnology. 

However on a day to day basis, for typical commodity, large scale filtration applications, there exists an inherent aversion to change. Much of this lies with the inability of the end users and element designers to move from existing technologies and accept change. Element manufacturers also fail to grasp the basic total cost of ownership value model and use technology to justify added value to their products. 

This in turn places constraints on the media designers who have to work within existing design and cost parameters. The end result is institutional paralysis. 

In short, whilst the car we drive may alter on the outside and even the powertrain systems advance, the systems that protect the engine are still essentially 50 year old technology hidden under the bonnet out of sight and do not look as if they will change soon.

They definitely are not iPhones!

Have fun....

Tony

Monday, 22 September 2014

Soot Filtration: How can you test for it?

In a recent blog on aerosols and dust I mentioned briefly soot testing. In this blog, I want to go into more detail about soot testing and some of the challenges and possible solutions that you can find out there. 

What is soot?
Soot is the result of the incomplete combustion of organic materials such as coal, wood, or liquid hydrocarbons. Soot particulates are associated with much of the urban pollution in both the developing and developed world and are often a major contributory factor to pollutants known commonly as "PM 2.5". As we will see, this is not technically correct for soot but the implications of these particulates on health cannot be underestimated, contributing significantly to premature deaths in extreme cases. 

The soot particle is not like a typical dust where the material is a defined material with a defined particle size range. Typically starting at about 50nm the hot soot particle from incomplete combustion will grow through particle coalescence over a short interval of time to around 100-120nm cooling from a hot, sticky particle to a cool, resinous material which is much harder. 

The result is that the behaviour of soot when interacting with filter materials can and does alter as a function of time so, a smaller hotter particle will stick to the surface of a filter whilst a cooler, harder particle will behave in a much more traditional way. 

The other issue to be aware of is that the chemical composition, it's softening point and particle size also depends upon the chemical nature of the combusting material as well as the level of oxygen at the point of combustion. This means that use of poorly defined materials such as kerosene can lead to significant differences in the nature of the soot. 

How does soot impact my filter? 
Soot in the air has a significant impact on the lifetime of filters, this is a well known and accepted fact. It leads to shorter operating lives of all air filters. Soot build up is also seen in lube/oil filtration where it enters into the oil and, again, can impact the lifetime of the element. 

Beyond this hot soot also passes through air filters and builds up on the airflow and other sensors in the air management system of a car or truck.   

How can I measure soot filtration? 
Simulating soot is one of the hardest challenges in filtration testing today. The inherent instability of soot particles makes standardising the testing protocols very challenging and this is, as of 2014, still in development. There are a number of different solutions in the market, the simplest being a small kerosene burner (Often known in the US as "Tiki Torches") feeding soot into an airflow. A typical example from Ahlstrom is shown below. 


Soot test stand set up (from Ahlstrom Particles Q1 2012 p3)
Other companies also have such a test set up including the test institute IBR. These systems can generate a very consistent particle size distribution between 90 and 150nm (if measured).

However the only problems that these set ups have is the probable inconsistency of the soot generated due to the reasons stated above due to the fuel, face velocity factors meaning that particle growth time and particle temperature at the surface mean that the nature of the particles can and will be different based on test scenario. Inconsistency and non traceability is a key issue that has to be addressed.

One final challenge with soot is the inherently long run times (30 minutes testing led to little or no pressure drop increase at 15cm/s on a typical flatsheet air filter sample). 

The issue of slow loading is a fundamental one in soot testing. If the concentration of soot is too high, it is not easy to measure the particle size because the number of particles per volume of air becomes too high and the actual particle size will be larger as the close proximity of the soot allows for more agglomeration of the particles. This is seen in all soot testing set ups. 

Exhausts
The obvious source of soot is the source that generates it. Some set ups use diesel engines as a source of soot (one ex colleague of mine once tried to use this as a justification for the company to buy a Bugatti but that didn't really work), funnelling the soot through to the test stand from there. Another, less subtle option used by a filter manufacturer with labs in central Stuttgart was to apparently syphon the air from the polluted street outside the building. However in both of these cases reproducibility elsewhere is the major challenge.    

Gas soot generators- Chilling off
In trying to standardise soot testing the ISO standards committee have tried to remove the inherent variabilities of such approaches and standardise the protocol. The current proposals are to generate a soot standard to ISO DIN 12103 which would be an annex to the current automotive air test standard (ISO 5011). The fuel here is ethylene or propylene burned in a controlled oxygen environment using nitrogen to control the degree of combustion. The soot is then quenched to fix the particle size and stop further coalescence and agglomeration of the particles. 

Such systems are already in commercial production by companies such as Matter  (known as REXS) and are used for both filtration testing and for testing of other systems (such as DPF catalysts by Bosch for instance).  This system can generate between 50mg/hour at 80nm and 3g/hour at the larger 200nm by increasing the concentration of the particles. 

The advantages of such a system is clear. The fuel is well known and chemically controllable, using a controlled quenching enables the particle size to be fixed easily. The biggest disadvantage however is the cost of the generator itself. 

Graphite erosion
One proposal from Palas is for a spark erosion of graphite. Such a system would use a high voltage system to erode a graphite rod in an inert atmosphere to generate particles of average particle size 98.9nm. The only disadvantage of this system is the relatively low rate of soot generation (0.06mg-7mg/hour) but this can be rectified by use of a small sample size. A concept developed by me shows the layout of such a system. 


concept soot test stand using spark erosion (Tony Lawson)


No soot at all? 
A more traditional approach to evaluating soot is to find an alternative aerosol with a similar particle size such as KCl. This has been used successfully to replicate soot. The biggest disadvantage is that it isn't soot. 

Soot Testing to EN779
A variant of the ISO 12103 proposed protocol was demonstrated to me recently by Unifil and really impressed me. Using propane to generate a quenched sample of average particle size 95nm which is able to test flat sheet samples very effectively to 450Pa. A typical sample on a F8 rated media showed the impact of soot with a DHC of around 2gsm to soot compared with a typical DHC of 237gsm using SAE ISO fine test dust on the same material using a flatsheet test stand. This is a significant demonstration of how  rapidly soot cant lead to a loss in performance. 

So in summary, soot is a nasty material that we have to remove from air. However it is a difficult material to simulate in a lab compared to real life and whilst innovative solutions exist to test soot these are yet to be formalised into documented, approved ISO standards. 

Thanks again for following my blog...until next time

Tony

Sunday, 21 September 2014

Are all test dusts created equal....?

In an earlier blog on aerosols and test dusts, I described how the test dusts are standardised in order to ensure that the testing of filters should be the same across all test locations. In some cases, however, the use of a standard formulation does not mean that all test dusts are created equal. In the case of soot, this is because the ISO standard still doesn't exist but in the case of AHRAE 52.1 test dust, the standard is documented and standardised but there are a number of suppliers in the market and this can lead to a significant difference in performance. 

ASHRAE 52.1 test dust is specified in the ASHRAE 52.2 test standarg as comprising the following components by weight:

    • SAE ISO Fine Test dust   72%
    • Powdered carbon             23%
    • Milled cotton linters            5%
There are two principle commercial sources for the test dusts, the US based Powder Technology Inc. (also known as PTI) and the frighteningly similar Particle Technology Ltd in the UK. 

During alignment work earlier this year we confirmed what is well understood in the market, that although both labs manufactured their dusts to the same specification, the performance of the test dusts on elements tested to EN779 was significantly different.   

A range of F8 and F9 synthetic bag elements were tested with both PTI and Particle Technology sourced ASHRAE 52.1 test dusts. Data was taken at 250Pa, 350Pa and 450Pa for DHC and fractional efficiency. The efficiencies of the media were within experimental error with each other (<2%).
0.4 micron Fractional Efficiency Offset between F8 and F9 filter elements tested to EN779 due to test dust source
However the impact of the different dusts on DHC was significant.

DHC offset between F8 and F9 filter elements tested to EN779 due to test dust source
The DHC of European sourced dust was close to 30% lower than that of US sourced dust. This confirmed other comments from major manufacturers of elements such as Camfil and AAF. 

Why? The reason is that whilst the specification is correct for both sources of test dusts, the US test dust appears to have longer cotton fibres in the blend. This causes lumps to form and these lumps do not load so evenly creating a looser filter cake on the surface of the media. This looser filter cake results in gaps that allow air to flow through the filter creating a lower pressure drop and longer lifetime. 

The lack of homogeneity of the US dust has a further knock on effect. The long fibres act to create lumps and these lumps can jam up the dust feeder from time to time. 

The inconsistency of this test dust has led to some labs to not use the ASHRAE test dust but to solely use the SAE ISO fine test dust (which in itself has a significantly higher lifetime than the ASHRAE test dust) and the forthcoming ISO 16890 will certainly be based on SAE ISO fine test dust as a consequence. 

So is this phenomenon limited to this dust? No even with single batches of SAE ISO test dusts there are often significant batch to batch variations seen for multipass. We saw this when we changed test dust batches of SAE ISO Medium Test Dust earlier this year. There was a sudden change in media lifetime for fuel media (ISO19438). 

In short ,batch changes or source of test dust do significantly impact the result so you always need to be aware of the impact of test dust source or even test dust batches.  

 Not all test dusts are therefore equal! So take care when analysing data side by side. 

Have fun. 

Tony

Friday, 19 September 2014

1.5 micron multipass measurements for high efficiency fuel media applications

My old boss used to say, "all projects start with a measurement system". In short, if you can't measure what you want to achieve, you can't achieve it. With the advent of EURO 6 engines (and higher demands for hydraulic filters in general), the capability of traditional ISO accredited multipass test stands is being significantly challenged as the traditional OPC's in multipass test stands are limited to a minimum particle size of 4 microns. 


Typical Multipass Test Stand from GMNi
With an initial efficiency at 4 micron of >99.5% required to meet the EURO 6 emissions requirements, the particle counter has to work harder than ever to accurately count the downstream particles. As 4 microns is the limit of the current ISO approved technology we face an increasing level of experimental error in media measurements which is exacerbated by the fact that customers also ask for initial efficiency not overall efficiency. 

Initial efficiency in ISO 19438 is measured over a period of only 3 minutes during the entire test (4-6 minutes) at which point the particle counts are increasing as the contaminant concentration in the test circuit increases from zero. The result is that the data is prone to significant errors at 4 microns for both initial and overall efficiency (see plot below for a typical cellulose meltblown composite) tested 7 times on the same lot of material to enable a level of inherent variability to be established. 

Inherent variability in overall efficiency for a typical flatsheet fuel media.
As you can clearly see, the level of inherent variability grows significantly as we approach 4 microns. This can only be expected of such a system operating at the edge of the measurement range. 

The key challenge therefore is to move the measurement goalposts. This is easier said than done but the market leaders in OPC technology, PAMAS, have introduced the latest in technology, known as SLS. Instead of operating with a 4-40 micron range OPC, the new technology operates with a 1.5 to 20 micron range OPC. 

The impact though in terms of multipass design is significant:
  • the cleanliness level in the test circuit has to be significantly improved thus requiring hydraulic filters with a Beta 1000 or 2000 level of efficiency of around 2-3 microns. 
  • The OPC upstream and downstream of the sample has to have a significantly lower concentration of dust and a much higher dilution is required. 
In short it is not possible to purchase a simple OPC and retrofit it to an existing multipass test stand. 

One other major issue is that the particle sizes are now outside of the ISO official range (i.e. they lie less than 4 microns) and so any test is not according to the standard which leaves companies scratching their heads. The solution is to have both technologies on the same test stand so that the test stand still abides with the ISO standard but has extended capability (i.e. two sets of particle counters!). 

The benefit of the new OPC technology is that it moves the 4 micron initial efficiency to the middle of the calibration curve (not the edge) and we can also start to look at 2 and 3 micron efficiencies that are naturally much lower than 4 microns and therefore a better discrimination in performance between media can be made. This is shown in a graph from a SAE presentation made by Ahlstrom on this technology. 

Fractional Efficiency of various media using SLS Technology.
The graph shows 5 grades tested using SLS technology. If we use the 4 microns as the cut off point we see that there is a little difference between the samples in terms of performance. However by extending the range to a lower particle size the different media perform significantly differently allowing  a more educated analysis to be undertaken of the different media in terms of their relative performance. 

Does SLS Technology measure identically to standard OPCs? 
We undertook a study on a test stand with two OPCs fitted on a Euro 6 level media to see what the resultant performance looks like. The result was very consistent across a range of grades. The new OPC shows a significantly lower initial efficiency than the standard OPC (see below).  

SLS and standard OPC initial efficiency performance on a Euro 6 media
Why the discrepancy? There are only two possible reasons; 
1. the OPC's are operating differently or
2. the media performance is "different" in some way from sample to sample.

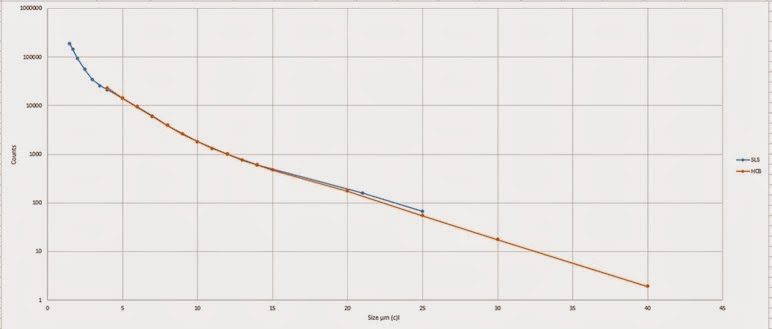
To look at point 1 we took the media out and looked at the particle counts of a pre-dosed test system (oil with a known amount of ISO medium test dust) and looked at the particle counts from both particle counters. 

Particle counts with no media of both HCB and SLS Particle counters
The number of particle counts are aligned extremely well in the overlapping range of 4 to 20 microns which would clearly exclude point 1 as a reason for the discrepancy. 

The theory currently is that the new OPC is detecting particles in the fluid downstream that the traditional technology can't. In this case the belief was that synthetic particles were being dislodged downstream from the media and were being detected in a way that the older HCB technology couldn't detect. 

So there you have it, there is a new technical opportunity to extend the efficiency range of fuel media being driven by a new capability to measure it. This technology not only extends the measuring range, it increases the precision of measurement and has an ability to identify particles that the current technology can't "see". 

The jury is still out on whether this technology will become mainstream plus the ISO committee with the 2003 standard is way behind the technology developments here. But there are test stands out there able to undertake this and it will not be long before we start seeing specifications at 2-3 microns being set by element manufacturers. 

Thanks a lot for reading and have fun. 

Tony


Friday, 12 September 2014

Larger particle sizes make for poorer element ratings in the proposed ISO 16890

In my blog on the new ISO 16890 standard, I got a lot of feedback on LinkedIn about the benefits and issues of the new proposed standard. 

There is one thing that I am intrigued by here and still don't feel that anyone has addressed and that is the need to move to a higher particle size. It was stated in the proposed standard that if we need to assess the efficiency of a finer filter F7+ we should look at the 1 micron data rather than the 0.4 micron data. 

Thinking about this this afternoon I did some analysis on data generated on three bag filters (rated F7, F8 and F9) tested some time ago. The elements were tested with both KCl and DEHS aerosol for fractional efficiency before and after IPA vapour discharge to the TC142 protocol from 2013. The particle size channels were set as per ASHRAE 52.2 (not EN779)  The data that I have showed a very nice and very significant relationship between the efficiencies at 2.57 microns, 1.14 microns and 0.47 microns.  


The issue I see here is that as you use a larger particle size, the efficiency range F7-F9 narrows significantly (so at 0.47 microns you cover a range of efficiency 35% to around 85%, a range of 50%, for the 3 elements but at 1.14 microns the range is now only 60% to 96%, a range of 36%) making the discrimination of efficiency ratings much harder to discriminate at 1 and 2.5 micron than at 0.4 microns making it much harder to effectively differentiate between good and bad filters commercially. 

Thoughts? 

Wednesday, 10 September 2014

Aerosols and Dust.....

In my blog on filtration testing, I alluded to the use of challenge dusts and aerosols for testing. In this blog I'd like to address this issue a little further. 

All filtration testing requires a predefined standardised material of known particle size to effectively determine the efficiency of the filter whether by arrestance (gravimetric efficiency) or by fractional efficiency using optical particle counters or Scanning Mobility ParticleSizer.

The selection of test aerosol or dust is determined by the ISO standard selected but also depends upon the nature of the filter being tested. Finally the selection of the aerosol has to align with the environment that the final filter will operate in. For instance, having a good filter for sand and dust will not give a good prediction of lifetime in a city where soot in the atmosphere will shorten the lifetime of the filter. 

The testing protocols used widely in the filtration world generally, not perfectly, reflect this. ISO committees all over the world spend many days drinking coffee and debating the detail of how filters should be tested. The resultant standards reflect the real life status and the standards continue to alter over time. 


Aerosols


….in automotive air
For lower efficiency media such as automotive air and heavy duty air, a dedicated, controlled particle size aerosol would not have the level of efficiency to make the measurement of fractional efficiency effective.  Consequently it is much more effective to measure the fractional efficiency of the challenge test dust.

...in lube, fuel and hydraulic applications
The major limitation in liquid filtration testing currently is the resolution of the OPC (Optical particle counter) technology. In air these go down to nanometer scale but in liquid filtration the technology only has a resolution to the micron scale. The current limit specified by all the ISO standards for liquid multipass filtration is 4 microns. More recent technology from Pamas in Germany has taken the limit down to 1.5 microns. This relatively poor resolution favours a relatively coarse test dust and the ISO standards all state the use of SAE ISO Medium test dust both for loading and as a measure of fractional efficiency. 

…in HVAC and industrial applications
For higher efficiency filters such as HVAC air cleaners, the selection of an aerosol is essential to measure the filtration effectiveness as measuring the fractional efficiency of the contamination dust would be ineffective. Consequently dedicated aerosols based on DEHS for EN779 and KCl are used to measure the fractional efficiency whilst a separate contaminant dust is used for loading. The particle size range is dictated by the test standard used and typically range from 0.3 microns to 10 microns.
The aerosols are statically discharged to remove the effect of static build on the aerosol particles up that can artificially raise the efficiency of the media.

…in HEPA and ULPA
For the highest level of filter efficiency the choice of aerosol is driven by the need to determine not simply the efficiency but the penetration of the particles. In a filter with efficiencies >99.95%, this means that <5 particles out of 10,000 are penetrating the media. Consequently the tests are carried out at a particle size known as MPPS (Most Penetrating Particle Size). The definition of this comes from the fundamental theories of filtration.
In larger particle sizes the key drivers of filtration mechanisms are driven by the fluid flow this leads to a linear particle flow into the filter where particle capture through inertia and interception dominate. As the particle size decreases, the probability of these events happening decreases.

At a point of a particle size of about 0.13-0.18 microns, the particles are so light and small that the macro effects of the fluid flow are overtaken by molecular buffeting and the particle starts to be moved sideways as opposed to forwards, this creates diffusion filtration mechanisms and below these particle sizes the efficiency effectively starts to rise (see figure below).


MPPS Efficiency Curve


The inflexion point is known as the MPPS, most penetrating particle size. Typically this lies between 0.13 and 0.18 microns and at this point the maximum aerosol penetration occurs.

Measurement of efficiency at this point focuses on a single particle size leading to a different type of particle counter which is range specific and typically a SMPS type design. The aerosol for HEPA and ULPA testing are typically oil based DOP (Dioctyl phthalate) or DEHS (Di ethyl hexyl sebacate).


Contaminant Dusts

The measurement of a filter lifetime is determined by the time to load up the filter with a contaminant to a known pressure drop. In order to achieve this, the filter has to be challenged with a realistic test that represents the environment in which the filter will operate. The will depend upon a whole host of environmental issues related to the location. Some examples are:
  •         Deserts and arid areas: Dust and sand
  •         Major conurbations, China and India: Hydrocarbons, soot and dust
  •         Sea: salt spray
  •         Mines: silicate and coal dust
  •         Building Interiors: Household dust

Each environment has a major challenge associated with it. The nature of the contaminants, particle size and the chemical properties associated with it. Each has an ability to significantly shorten the lifetime of the filter element and impact the overall performance through pore blocking and rapid pressure rise.
Each of these topics is a major subject in itself but in essence the ISO tests, to a degree try to reflect the environmental challenges in which the final filter will operate.

SAE ISO Test Dusts
The most common standard contaminants used for loading studies are based on the SAE ISO test dusts. There are 4 common dusts from Arizona in the US specified to ISO 12103-1. Details of the compositions of these dusts by volume (not weight) are shown in the Table below.


SAE ISO Test dust compositions by volume
Of these, the most commonly used test dusts are:
  • A2 ISO fine test dust is widely used for automotive air filtration with some limited use of A1 ultrafine test dust for higher efficiency filter media.
  • A3 ISO medium test dust is specified for liquid filtration where the particle counters are unable to operate effectively below 4 microns.


ASHRAE Test Dust
For higher efficiency HVAC applications, the specially formulated ASHRAE 52.1 test dust is specified. This is a blend of:
  • 72% SAE ISO A2 Test Dust
  • 23% Carbon black powder
  • 5% Milled cotton linters

The cotton linters can limit the ability of standard dust feeders to cope with the long fibres and the standard feeder for ASHRAE 52.2 and EN779 is in fact a conveyor belt with a vacuum slot to suck the dust in pre-cut segments into the airflow. For large elements this is suitable however for smaller flatsheet stands this is inadequate as it is too crude for the much lower airflow. Consequently the flatsheet testing in H&V has to be undertaken with SAE ISO A2 medium test dust which makes a suitable alternative.

KCl or NaCl loading
For most HEPA and ULPA applications testing, the loading capacity is not a measured outcome of filtration testing. However for some applications such as face mask, or higher efficiency air applications, NaCl or KCl loading can be seen as a viable test of element lifetime. However the testing time is extremely long and therefore the test requirements look at loading to a limited pressure drop increase or to a limited mass (Facemasks)

Soot
The growth in pollution in developing countries and conurbations in Western cities has led to a significant growth in trying to understand the impact of soot. Unlike a standard dry, hard particle such as Arizona test dust, soot is a complex organic material that doesn’t have a specific, controllable particle size.  Typically starting at about 50nm the hot soot particle from incomplete combustion will grow over an interval of time to around 100-120nm cooling from a hot, sticky particle to a cool, resinous material which is much harder. This inherent instability makes standardising the testing protocols very challenging and this is, as of 2014, still in development. Use of KCl as a viable alternative in terms of particle size distribution has been validated but not fully accepted in the market. There are commercially available soot generators from Matter Aerosol and some excellent new ideas from Palas but many test systems use home made soot generators using kerosene as a basis. 
As with KCl/NaCl loading, the real challenge is to be able to effectively load with soot in a realistic test timeframe. 


As usual, if you have any comments about this or any other blogs, feel free to comment and contact me.